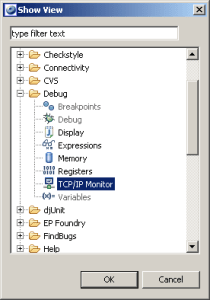
This article presents a tool in Eclispe IDE to monitor the exchanges between a client (browser) and your server. In fact, the TCP/IP Monitor is a simple server that monitors all the requests and the responses (TCP/IP activity) between a Web browser and server. It is very great tool to analyze the complexe request/response (like JSON).
So, TCP monitor eclipse plugin allows the testing of web applications by enabling the capture and analysis of messages sent and received from a port and a specific host. The monitoring tool TCP / IP can save messages to a log file, which can then be analyzed.
Installation/Open:
Download TCP/IP Monitor this is plugin from Eclipse Web Tools Platform (WTP) Project: a jar library keep it under eclipse installation plugin directory and restart eclipse.
To open the TCP/IP Monitor, view goto Windows -> show view -> others -> TCP Monitor:

Utilization:
To add a TCP/IP monitoring server, go to “Properties” of TCP/IP Monitor by right-clic and click Add. To add a new Monitor, it is necessary to specify the following settings, then click OK:
- Local monitoring port: Specify a unique port number on your local machine.
- Host name: Specify the host name or IP address of the machine where the server is running.
- Port: Specify the port number of the remote server.
- Type: Specify whether the request type from the Web browser are sent by HTTP or TCP/IP. If the HTTP option is selected the requests from the Web browser are modified so that the HTTP header points to the remote machine and separated if multiple HTTP requests are received in the same connection. If the TCP/IP option is selected, all the requests are sent byte for byte and the TCP/IP Monitor will not translate or modify any requests that it forwards.
- Timeout (in milliseconds): Specify the length of time, in milliseconds, that you can wait before ending the TCP/IP connection to a server.
In above example, we analyze the request coming to our server localhost on port 9999, then forward these requests to this same server localhost on port 8080.
And, of course, the tool shows also the response from this server to client (broswer).
So when, we request the URL http://localhost:8080/test_extJs_1/huoMVC/, the monitor server is not sought (no activity) because we request directly the port 8080.

But, we request the URL http://localhost:9999/test_extJs_1/huoMVC/, then the monitor server is sought (activity) because we request directly the port 9999 for analyzed:
Main request:

The requests for the images resources:

The requests for the Javascript resources:

And last, we could see an AJAX request and response in JSON format:


Hi there, yeah this article is in fact fastidious and I have
learned lot of things from it on the topic of blogging.
thanks.
Can you tell me how to save those requests/responses shown in TCP/IP monitor? Thanks.
Hi,
Could you precise your question?
because you could save these request and response by simply select all text by “CTRL+A” (select all) and copy/paste the selected text….: )
Best regards,
If there are 30 requests/responses (XML) in TCP/IP Monitor that I want to study, it would be too heavy for me to copy 30 requests and then 30 responses one by one into notepad… So, I want to know if I could save or export all of them all together. Thanks.